
Thesis: Walt Disney Company (DIS), is well positioned to achieve higher top-line and bottom-line growth in the entertainment media sector. Disney’s monetization strategies of its content and recent development of new distribution channels will not only generate strong growth, but also drive multiple expansions as the company moves into subscription-based digital media. Our research shows that Disney is significantly undervalued and rates the stock as Strong Buy as of 11/26/2019, with a target price of $207.5 per share.
Key Takeaways:
- Traditionally, Disney has been a strong content creator, having established a line up of premium brands. However, it exhibited weaknesses in its capability to distribute its content. With the launch of ESPN+ and Disney Plus, it now has the potential to complete its content-to-distribution supply chain. This will drive both revenue growth and multiple expansion in the next 3-5 years.
- Disney’s Park and Resorts segment has been growing consistently at a strong rate. It is expected to continue to growth rate with the trend of “experience entertainment”.
- Disney’s stock is currently extremely undervalued even under the most conservative assumptions.
Businesses: Walt Disney Company is a global corporation with multiple services, primarily focused on media and entertainment. It currently has four reporting segments: media networks, parks and resorts, studio entertainment, and consumer products.
- Media Networks is traditionally the largest segment of Disney in terms of revenue; it is the 2nd largest in 2019, behind parks and resorts. It consists of a variety of internationally renowned brands that are either cable or network based, including ESPN, Disney, ABC, Vice Media, etc. This segment primarily generates revenue through cable subscriptions in the traditional fashion. Media Networks generated $24.55 billion in revenue in 2019, a 0.21% YoY growth from 2018.
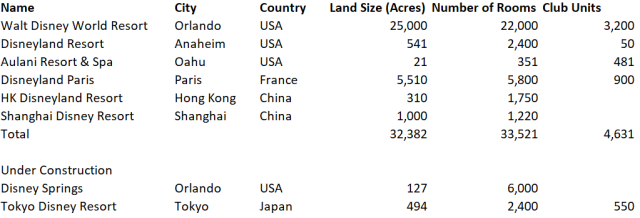
- Parks and resorts consist of five traditional all-comprehensive Disneyland resorts across the world (Orlando, Anaheim, Paris, Hong Kong, Shanghai). These resorts typically include multiple theme parks, shopping area, and hotels. In addition, Disney operates a spa resort in Oahu, Hawaii. In total, Disney operates on 32,382 acres of land and provides 33,521 hotel rooms. Presently, Disney is developing an all-comprehensive resort in Tokyo and a 127-acred shopping area in Orlando. This segment is responsible for $25.73 billion in revenue in 2019.
- Studio Entertainment is the movie-making arm of Disney. It includes subsidiaries such as Walt Disney Pictures, Pixar, Marvel, Lucasfilm, Touchstone, and 21st Century Fox. In addition, Studio Entertainment segment includes Disney Music Group (DMG). The segment generated approx. $10.62 in revenue in 2019.
- Consumer products, the smallest segment of Disney by revenue, ($8.7 billion in 2019), primarily generates revenue through licensing content and characters to 3rd parties, selling Disney-related merchandise (toys, books, apparel), selling content to game developers, and charging tuition in English-learning center in China.
Table 1: Disney Operating Segments Financial Performances by Revenue
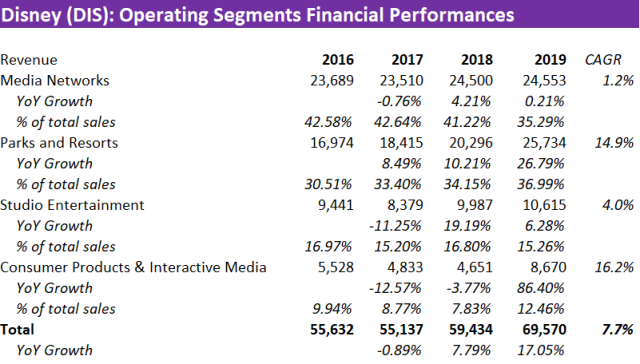
Table 2: Disney Operating Segments Financial Performances by Operating Profit
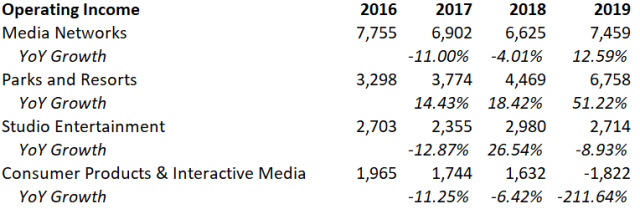
Table 3: Operating Information of Various Disney’s Parks and Resorts
Competition & Moat: Disney has been tremendously successful in its content creation, marketing effort, operational strategies, financial acquisitions, protection of its trademarks, etc. The success has given rise to a dominant competitive position that Disney currently enjoys. Since the company has lines of businesses that are very different from one another, its competitors vary depending on the segment. Within the Media Networks segment, Disney is subject to relatively intense competition, coming from a few concentrated powerhouse competitors such as Comcast, AT&T/Time Warner, and Viacom. The four companies collectively make up 58% of the total market share. The total industry revenue in 2019 is $92 billion. The market share of Disney in this segment is 26.7%. Although the competition is fierce, it is far from perfect. The cable & network industry is quite segmented based on style. Disney has successfully carved out a profitable niche in sports and kids’ content.
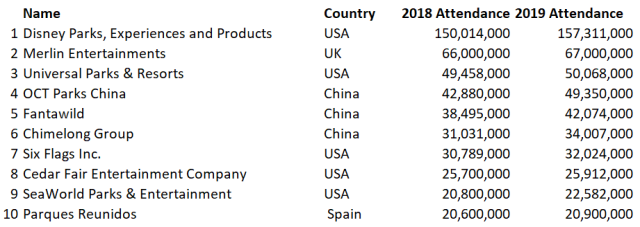
Disney’s parks and resorts segment, on the other hand, dominates globally. The segment not only enjoys a global presence, but also a moat that is rare to find in this line of business. Disney’s competitions in this segment primarily include some international companies such as Merlin Entertainment, Universal Parks, and numerous locally operated theme parks. In 2019, Disney branded resorts had 157 million in attendance, by far the number one in the world, in fact, close to the next three players combined. The success of Disney’s parks and resorts are largely attributed to the overwhelming success of Disney’s Studio Entertainment segment. Disney’s Studio Entertainment branch has produced countless classics over the years, such as The Lion King, Star Wars, Toy Story, Marvel, etc. These titles are heavily present in a child’s childhood. The child dreams to visit Disney’s parks and resorts in hopes of being immersed in the world that he/she saw on the silver screen. The consistent success of Disney also endows itself with a very wide moat. When choosing content for their kids, parents have an innate trust in a Disney title vs. a movie that is produced by an unknown company, and the majority of parents will be willing to pay a premium for the Disney title. Total revenue in movie & TV industry in 2019 is $286 B, in which Disney is responsible for $10.6 B, less than 4% of the behemothic industry.
Table 4: Attendance of the 10 Largest Theme Parks in 2019
Operational & Financial Considerations: Disney’s strengths primarily include its ingenuous content creation, its brand loyalty/moat in movie business, the dominant competitive position of its parks and resorts, and its strong management. First of all, Disney is traditionally a content creator, a successful one at that. It has been able to deliver hit titles in a variety of genres and see few misses. Secondly, these titles not only are acclaimed critically, but also have a huge cultural influence. The cultural influence causes Disney to enjoy a wide moat. Parents tend to pay premium for Disney titles than unknown films for their children to watch. Thirdly, Disney’s parks and resorts are worldly renowned, to the extent that if Disney buys a piece of land in the middle of nowhere, the purchase will drive up market demand in that area, causing the land to instantly appreciate in value. Finally, Disney has a very strong management team, led by Robert Iger, who started his career in Disney.
Disney has few glaring weaknesses. One weakness had been its inability to distribute its own content effectively in a well-monetized fashion. With the advent of Disney’s plus and ESPN+, the company now has completed its supply chain, from content to distribution. Content creation, traditionally, has been valued at a lower multiple than distribution channels, primarily because the market believes that there is a wider moat (competitive advantage) in the distribution business than the content business. This causes Facebook, for example, to be valued significantly higher than Comcast on per dollar of earning basis. The logic behind this is simple, the switching cost for a customer to watch another movie is a lot lower than subscribing to a new streaming service than Netflix. However, with the acquisition of 21st CF and Hulu, Disney has amassed sufficient content to develop its own distribution channel in ESPN+ and Disney Plus.
In the short term, Disney is faced with the threat that comes from other distribution channels. While it is true that the sheer presence of a distribution channel will considerably boost the revenue growth for Disney, the path isn’t one without strong challengers. For one, Netflix has been in the distribution business longer, and has successfully completed the combination of content and distribution in its own right, by adding a content creation arm in this case. Amazon, through the development of Amazon Studio and Amazon Prime, is eyeing the very business that Disney is in. Amazon has achieved tremendous success in its content creation, producing Manchester by the Sea, an Oscar nominated film in 2017. In the long run, the media entertainment industry will face significant disruptions. The advent of AR and VR, combined with the 5th Generation network, will upheaval what we define as entertainment today. The long-term success in this industry will heavily depend upon the vision and the adaptability shown by a company’s management.
Most of Disney’s revenue would be considered discretionary entertainment, and therefore is cyclical with the macroeconomic environment. Within a given year, Disney experiences moderate cyclicality, with over 65% of revenue generated in Q3 (Apr. – June) & Q4 (Jul. – Sept) (Table 1).
Growth Catalysts:
In the near term, I see three main sources of growth catalysts, the realization of which will drive the stock price to merge with our target price:
- The success of its distribution channel: if Disney proves that it can successfully manage distribution of its content, it can experience a significant multiple expansion in valuation as it transforms its image to a digital media from cable & networks.
- The entering of the Chinese market: Disney introduced the firm Chinese Superhero earlier this year to take advantage of the Chinese market. If Disney can successfully leverage its brand and carve out a niche in the Chinese market, it will drive significant revenue boost.
- Disney is well-positioned to emerge as the global leader in the “experience entertainment” business. It already owns renowned resorts across the globe with over 150 million annual visitors. It can really take advantage of the new wave of “experience entertainment”.
Valuation
Cash Flow Valuation:
I built a robust Discounted Cash Flow Model in valuing Disney. The model takes into considerations of Disney’s new product lines (Disney Plus and ESPN+), its product development cycle in its studio entertainment segment, while at the same time allow for uncertainties in Disney’s revenue growth and operating profit margin.
First and foremost, the model selects six years as the projection period (starting 2020), in order to fully reflect the effect of Disney’s distribution channels and its Studio Entertainment cyclicality. The forecasts growth rates for each of its four segments, under three different operating scenarios – upside, base case, downside. The nature of the company behind all three scenarios remains the same. The only difference is how successful each of the segment turns out to be. Three key points in revenue projections are: (The specific revenue projections are laid out in Table 5).
Table 5: Revenue Growth Projections from 2020 – 2026

- Media Networks segment is expected to experience higher growth in the next three years before slowing down to a long-term average. This growth is driven by the adoption of Disney’s distribution channel.
- Parks and Resorts segment is expected to continue the trend of consistent, strong growth. It is expected to permanently overtake Media Networks as the largest operating segment.
- Studio Entertainment is expected to experience low revenue growth until 2023. Disney’s studio entertainment has a 4-6-year development cycle. The success in a given year (e.g. 2018) is built up gradually over time with the releases of many films.
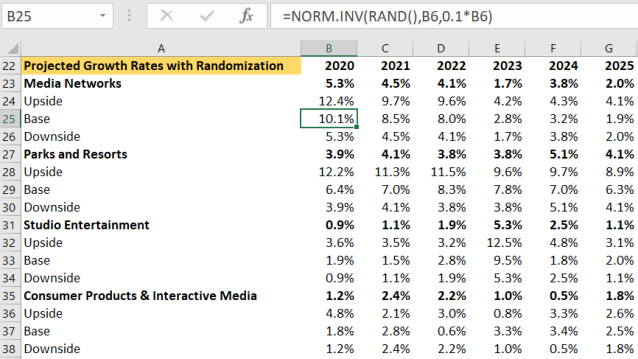
- Randomness and fluctuations are allowed for in each of the segment. The forecasted revenue growth rate for each segment is treated as the mean in a normal distribution, with 10%* growth rate being the standard deviation (Table 6).
Table 6: Revenue Growth Projections from 2020 – 2026 with Randomization (a snapshot)
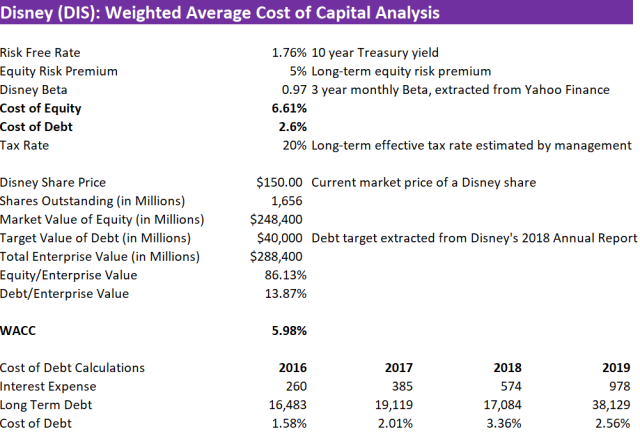
The weighted average cost of capital (WACC) of Disney is calculated to be 5.97%. Risk free rate is the prevalent 10-year US Treasury yield, 1.76%. Disney’s 3-year monthly equity beta is 0.97. The management team targets a debt level of $40 B and its cost of debt is 2.56%. The management estimates a long-term tax rate of 20% in all its international operations (Table 7).
Table 7: WACC Calculation for Disney
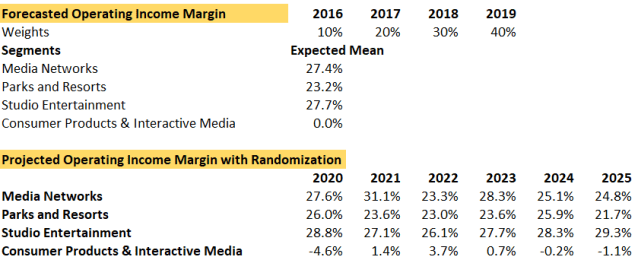
Operating income margin is another key input of the model. The three-step method that the model uses to project the overall operating profit margin is as follows (Table 8):
- As a starting point, the model takes the financial performances of Disney’s four segments in the past four years and calculates a weighted average for each segment with the weighting of 10%, 20%, 30%, 40% for 2016, 2017, 2018, and 2019 respectively.
- The model then makes adjustments to the margin of each segment. The margin of Media and Networks segment is reduced by 2% due to a higher cost structure with the distribution channel. The margin of Consumer Products is assumed to be 0% going forward. These margins are called the “expected margins”.
- The model then allows for randomness and fluctuations from year to year by assigning each segment’s margin to a normal distribution N~(expected margin, 10% * expected margins). The exception is that Consumer Products segment, which has the mean of 0%, is given 5% as its standard deviation due to its high margin volatility (Table 8).
Table 8: Operating Profit Margin Projections for Disney’s segments 2020 – 2026 with Randomization (a snapshot)
With a mid-year discounting approach, the sum of the discounted unlevered cash flows over the projection period is $66.7 B. The undiscounted terminal value at the end of year six is calculated as $438.79 B, using the current level of EV/EBITDA multiple of 18.77x. An EV/EBITDA multiple of 18.77x implies a perpetual growth rate of 2.4%, which is reasonably conservative, and inline with the GDP growth rate (Table 9).
Table 9: DCF Valuation Model of Disney with Base Case Scenario
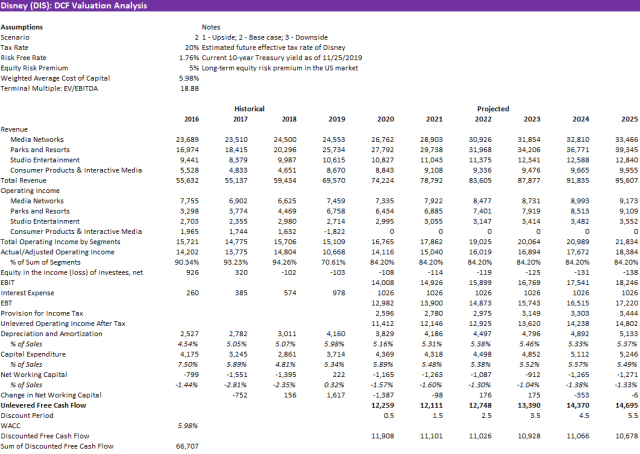

This gives an enterprise value of $376.5 B in present value terms. Removing $40 B in debt and adding back $5.41 B of cash, the model derives Disney’s equity value to be $341.9 B, or $207.5 per share. The current market cap of Disney is $247 B, or $150 per share. The model shows an upside of 38.34% (Table 9).
Following this, I conducted a sensitivity analysis on the valuation result, by changing WACC and terminal multiple. The result is encouraging, with the lowest valuation being $157, still higher than the current market valuation (Table 10). I then ran the model with both upside and downside operating scenario. The results are shown in Table 11.
Table 10: Sensitivity Analysis with Terminal EV/EBITDA and WACC under Base Case Scenario
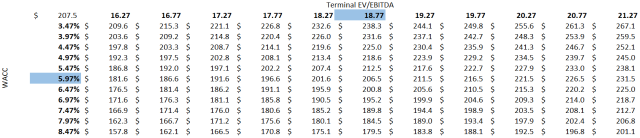
Table 11: Sensitivity Analysis with Different Operating Scenario

Multiple Valuation:
In addition to the DCF model, I also performed valuation on Disney with a comparable multiple approach. Since Disney’s segments are different in nature, three sets of comparable companies are selected for the purpose of valuation: traditional media, digital media, and consumer discretionary. Table 12 lays out the specific comparable companies used. Note that for consumer discretionary, the entire Vanguard Consumer Discretionary Benchmark (Not VCR, but the actual benchmark) is used, which holds 340 companies. We used the benchmark rather than specific companies because Disney’s parks and resorts segment and consumer products segment are unique in nature. No publicly traded companies on a standalone basis can be found to indicate the level of market valuation. However, both segments exhibit traits that are specific to the consumer discretionary sector. Therefore, the overall sector is selected. (Table 12)
Table 12: Comparable Valuation of Disney (DIS)
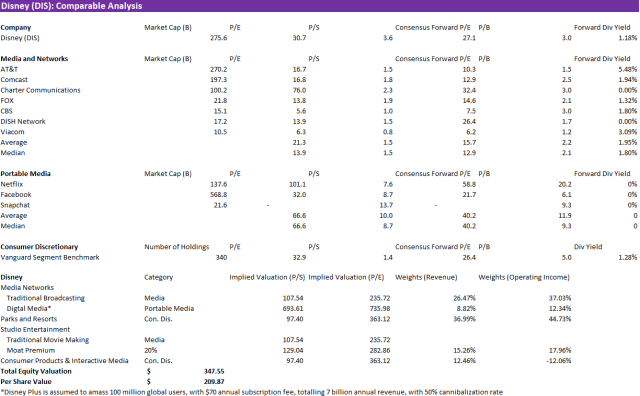
- Media Networks segment generates the majority of revenue similar to a large traditional cable and network company, such as AT&T, CBS, Fox, etc. However, since Disney is launching its own digital distribution channel, it will also partially resemble a digital platform. In fact, the revenue from Disney Plus is expected to represent 25% of the total revenue from Media Networks, with the assumption that Disney will reach 100 million global subscribers with 50% revenue cannibalization rate.
- Parks and resorts exhibit traits specific to the consumer discretionary sector. Hence multiples from the consumer discretionary benchmark is used.
- Studio Entertainment segment is mainly competing with other large movie studios, that are mostly owned by large cable and networks companies. Therefore, the traditional media set is used. However, since Disney has extremely sticky brand names in its studio business, a 20% premium is applied.
- Consumer Products segment is compared with the consumer discretionary benchmark.
The P/E multiple from each comp set is used to value the entire company. The valuation from each segment is then weighted according to the segment’s weight in terms of operating income (Table 12).
The final weighted valuation derived from our mode is $347.6 B, which translates to a per share valuation of $209.87. This valuation is notably close to the result of our DCF model, which is $207.5. We believe that this is a confirmation that our DCF model is credible and further proves that Walt Disney Co. is extremely undervalued by the current market.
